
Temperature in Perspective
Climatists argue that the Modern Warming, the rise in global temperatures over the last 140 years, is abnormal in Earth’s history. They then conclude that human contribution to a trace gas in our atmosphere, carbon dioxide, must have caused this rise.
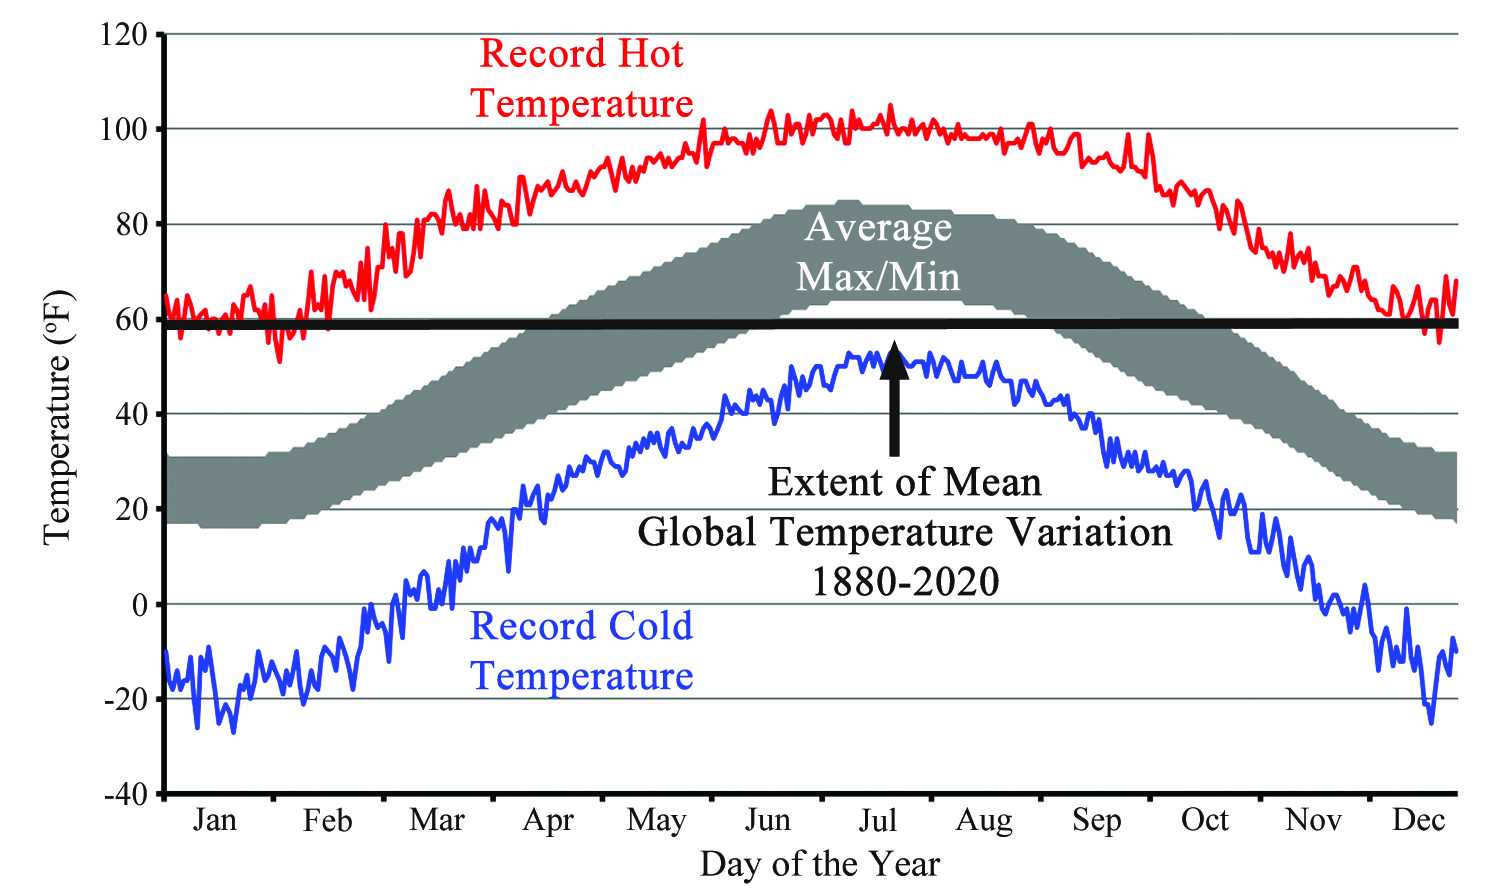
But a closer look at temperatures shows that the rise in Earth’s average temperature over the last 140 years has been only about 1.2 degrees Celsius or 1.8 degrees Fahrenheit. In Chicago, temperatures typically swing from about -5°F on the coldest winter day to about 95°F on the hottest summer day, or about 100 degrees in a single year. Compared to the annual swing in daily Chicago temperatures, the one-degree Celsius rise is global temperatures during the Modern Warming has been tiny.
So have past temperatures been constant, as the Climatists claim? Most geologists know that the sites of London, New York, and Chicago, along with much of the Northern Hemisphere, were buried in ice 20,000 years ago during the last ice age. Global temperatures changed as much as 7°—12°C as Earth moved from glacial to interglacial periods in geologic history.

In addition to the ice ages, a vast body of additional evidence shows that Earth’s temperatures are always changing. While the database of modern thermometer measurements only stretches back 140 years, proxy data allows a look at more distant past temperatures. Measurements of oxygen isotope proxies from ice cores in Greenland show periodic warm and cool periods including the Medieval Warm Period and the Little Ice Age, when temperatures were both warmer and cooler than today’s temperatures. The measurements also show multi-century-long periods when Earth’s surface temperatures were warmer than temperatures of today. Today’s temperatures are not historically warm. Natural climate change is not only real, but continuous.
The Greenhouse Effect

Sunlight, which is high energy radiation, enters our atmosphere and is absorbed by Earth’s surface. Like any warm body, Earth emits radiation. Since Earth’s temperature is lower than that of the sun, Earth emits lower energy radiation called infrared radiation, which is not visible to our eyes. Some of this infrared radiation passes back out of our atmosphere into space, but most is absorbed by greenhouse gases in our atmosphere. The warming caused by this absorption of infrared radiation is called the greenhouse effect.
The greenhouse effect is the theoretical basis for the theory of human-caused global warming. Most greenhouse gases in our atmosphere are created by natural climatic processes, so the greenhouse effect is a natural effect. But emission of greenhouse gases from human industry adds to the effect. Climatism warns that man-made greenhouse gases are the cause of rising global surface temperatures and will cause catastrophic climate change. But quantifying the amount of the greenhouse effect contributed by mankind is key to estimating the impact.

Our atmosphere is composed of about 78 percent nitrogen gas, 21 percent oxygen gas, a small amount of water vapor, and other trace gases. Carbon dioxide is a trace gas. Only four molecules in every 10,000 in Earth’s atmosphere are carbon dioxide. The amount of CO2 that mankind may have added in all of human history is only a fraction of one of those four molecules. Yet, Climatists claim that this fraction of one in every 10,000 air molecules is causing catastrophic climate change.

What is nature’s most abundant greenhouse gas? The answer is water vapor! Air typically contains 500 times more water vapor than CO2. Depending upon local humidity, water vapor can form about two percent of the atmosphere, serving as the Earth’s dominant greenhouse gas. Most scientists estimate that water vapor causes between 75 percent and 90 percent of Earth’s greenhouse effect. If we use the conservative number, about 75 percent of the greenhouse effect is due to water vapor and clouds. Of the remaining portion, about 19 percent is due to carbon dioxide, with 6 percent due to methane and other gases. But as indicated by the Carbon Cycle Model of the Intergovernmental Panel on Climate Change (IPCC), only about 3 percent of the CO2 placed into the atmosphere each year is from human emissions. So, of the last 25 percent of the greenhouse effect that is due to carbon dioxide and methane, only about 3 percent of this is due to man-made sources.
This means that human-caused emissions are responsible for only about 1—2 percent of the greenhouse effect. When we consider the effects of evaporation, convection, and weather, human effects on global warming are even less than this one percent. This small effect is impossible to even measure in Earth’s surface temperatures.
Icecap Melting and Sea Level Rise?
Rising ocean levels are one of the greatest pending catastrophes proclaimed by Climatism. Warming global temperatures, resulting in the melting of Earth’s icecaps, are the predicted cause. Al Gore, James Hansen, and others predict a sea level rise of 6 meters (20 feet) or more by the year 2100. Sea level rise in the 21st century, if measured in meters, would certainly be a disaster for coastal cities and nations around the world. But what can we really expect? Are Earth’s icecaps melting at an alarming rate?
Most of Earth’s ice is contained in the Arctic Icecap, the Antarctic Icecap and the Greenland Icecap. The Arctic Icecap, containing about 1–2% of Earth’s ice, declined about 19 percent from 1979 to 2021. Climatists have called this the “canary in the coal mine” and claim that this decline is caused by human-caused greenhouse gases and is a sign of pending disaster. But Arctic ice is floating in the Arctic Ocean. Even if all of it melts, sea levels would not rise by a measurable amount. In addition, Arctic ice has expanded and receded many times in history due to natural causes.
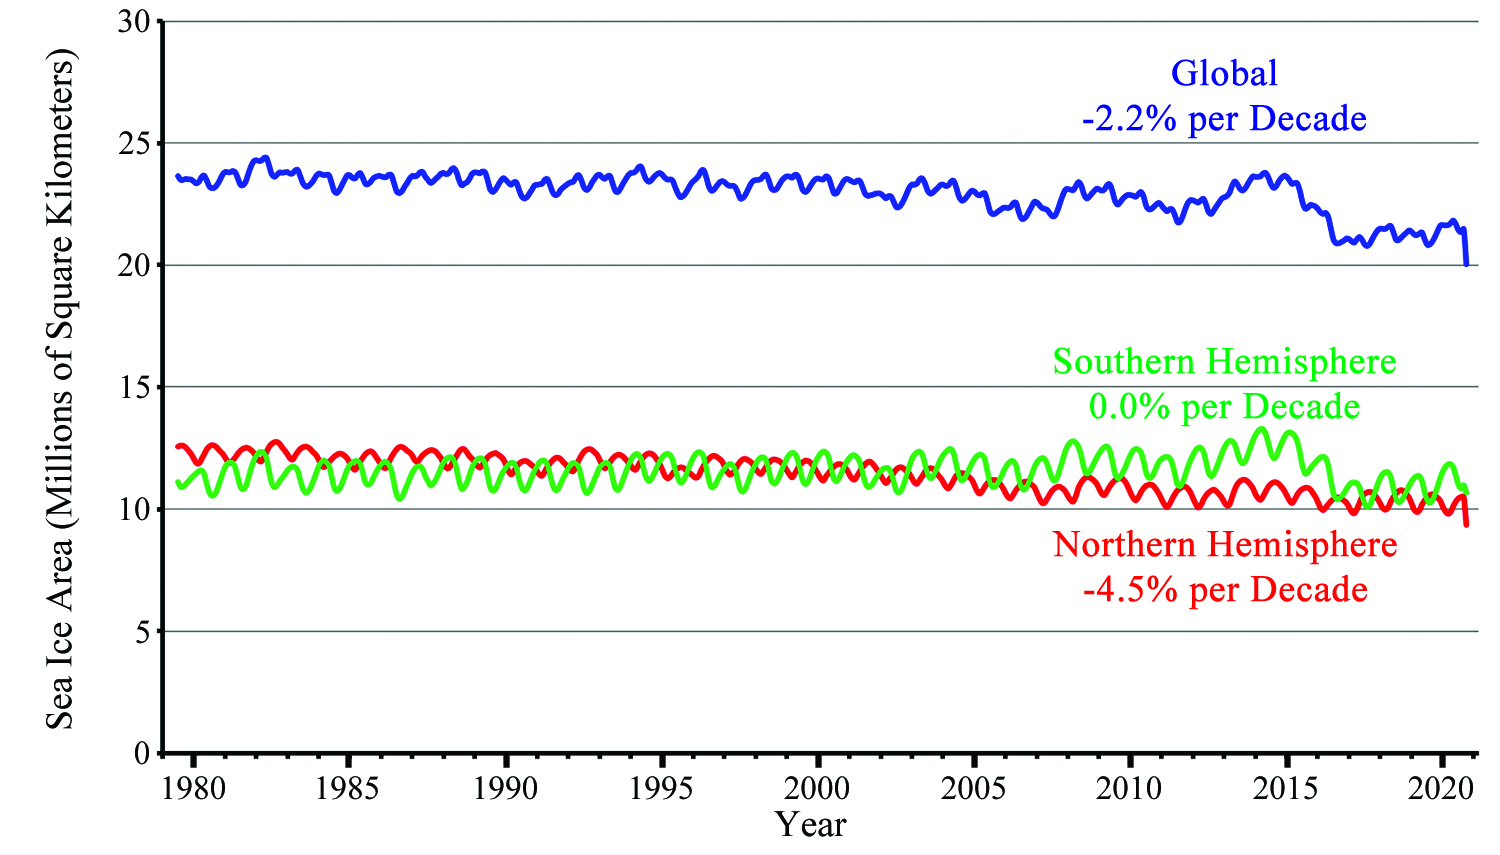
Climatists warn about the decline in the 1–2 percent of Earth’s ice found in the Arctic, but rarely discuss the Antarctic Icecap, which holds about 90 percent of Earth’s ice. The reason is that satellite images show that Antarctic sea ice has been stable for the last 30 years. Antarctic land ice around the South Pole has been thickening over the last 50 years. Despite predictions from climate computer models, Antarctic surface temperature have been mostly unchanged over the last 30 years.
Greenland holds most of the rest of Earth’s ice, about 8–9 percent of the total. Greenland ice has been shrinking for several decades during Earth’s recent gentile warming. Since 2002, Gravity Recovery and Climate Experiment (GRACE) satellites have been measuring Greenland ice loss. The measurements show an average loss of 279 metric tons of ice per year. If this rate were to continue, Greenland would lose about 10 percent of its ice in 1,000 years, raising ocean levels by about 0.8 meters or 30 inches in 10 centuries.
In summary, Antarctic ice is, on average, unchanging; Greenland ice is slowly melting and contributing about 3 inches of sea level rise per century; and Arctic sea ice is losing about 4.5 percent per decade without adding a measurable amount to sea levels. Ocean levels have been rising for at least the last 20,000 years. Scientists at the National Aeronautics and Space Administration (NASA) estimate the rise at 120 meters (390 feet). No one is able to tell when natural sea-level rise ended, and “man-made sea-level rise” began. For the last 150 years, ocean levels have risen at a rate of about 7–8 inches per century, far less than the 20-foot rise predicted by climate alarmists. Mankind will need to adapt to naturally rising seas as we have always done, but a catastrophic rise is unlikely.
Stronger Hurricanes and Storms?
Climatists love inclement weather. Every hurricane, tornado, drought, flood, and even snowstorms have become “evidence” supporting the theory of human-caused global warming. But a look at history shows that current weather events are neither more frequent than past events nor more violent than weather of the past.
In 2005, Hurricane Katrina hit New Orleans with Category 3-force winds estimated at 125 mph. The subsequent failure of levees in the city made Katrina the most destructive in US history in terms of economic losses. That same year, hurricanes Dennis and Rita hammered the Gulf Coast, while Wilma devastated South Florida. The years 2004–2005 rivaled 1993–1994 and 1997–1998 for the most active hurricane periods in recent history.
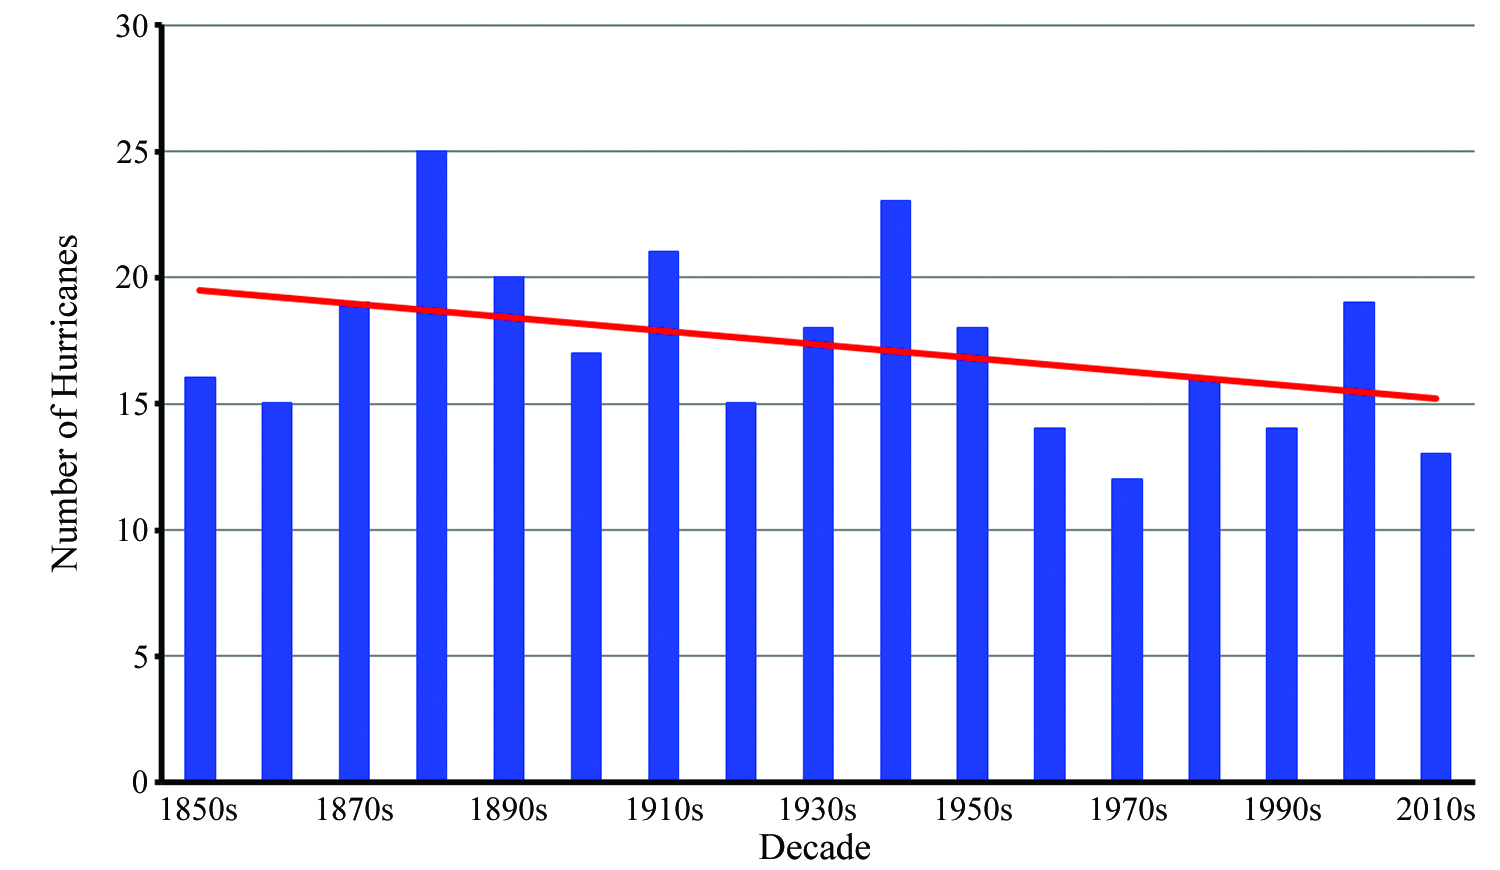
Data from the National Oceanic and Atmospheric Administration (NOAA) shows that about two hurricanes strike the US each year. But the data also shows that the number of hurricanes making landfall each decade has been flat to declining since 1850.
Meteorologist Dr. Ryan Maue uses satellite data from NASA to track the number and strength of tropical cyclones globally, including both tropical storms and stronger hurricanes. The data shows that during each 12-month period, roughly 90 tropical storms are active on Earth’s surface. These are cyclones that reach tropical-storm strength, which is a maximum-lifetime wind speed of at least 34 knots. About half of these storms also attain hurricane-strength wind speeds of a maximum-lifetime speed of 64 knots.
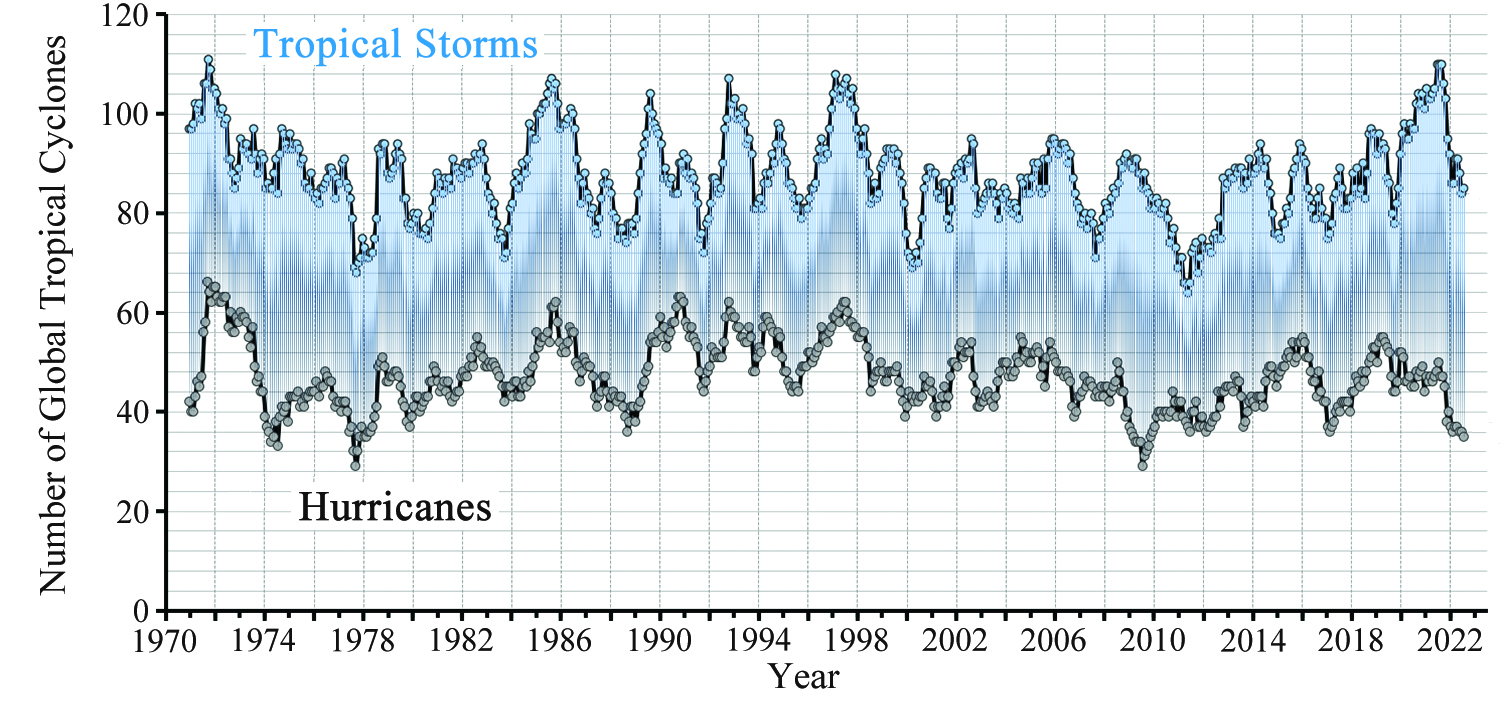
A review of tropical cyclones from 1971 to 2022, the period for which satellite data is available, shows no increasing trend in either the number of tropical storms or the number of hurricanes. The chart at right is also a measure of storm strength. If storms were getting stronger over time, more would attain hurricane-strength wind speeds and the number of hurricanes would be increasing. But it isn’t happening.
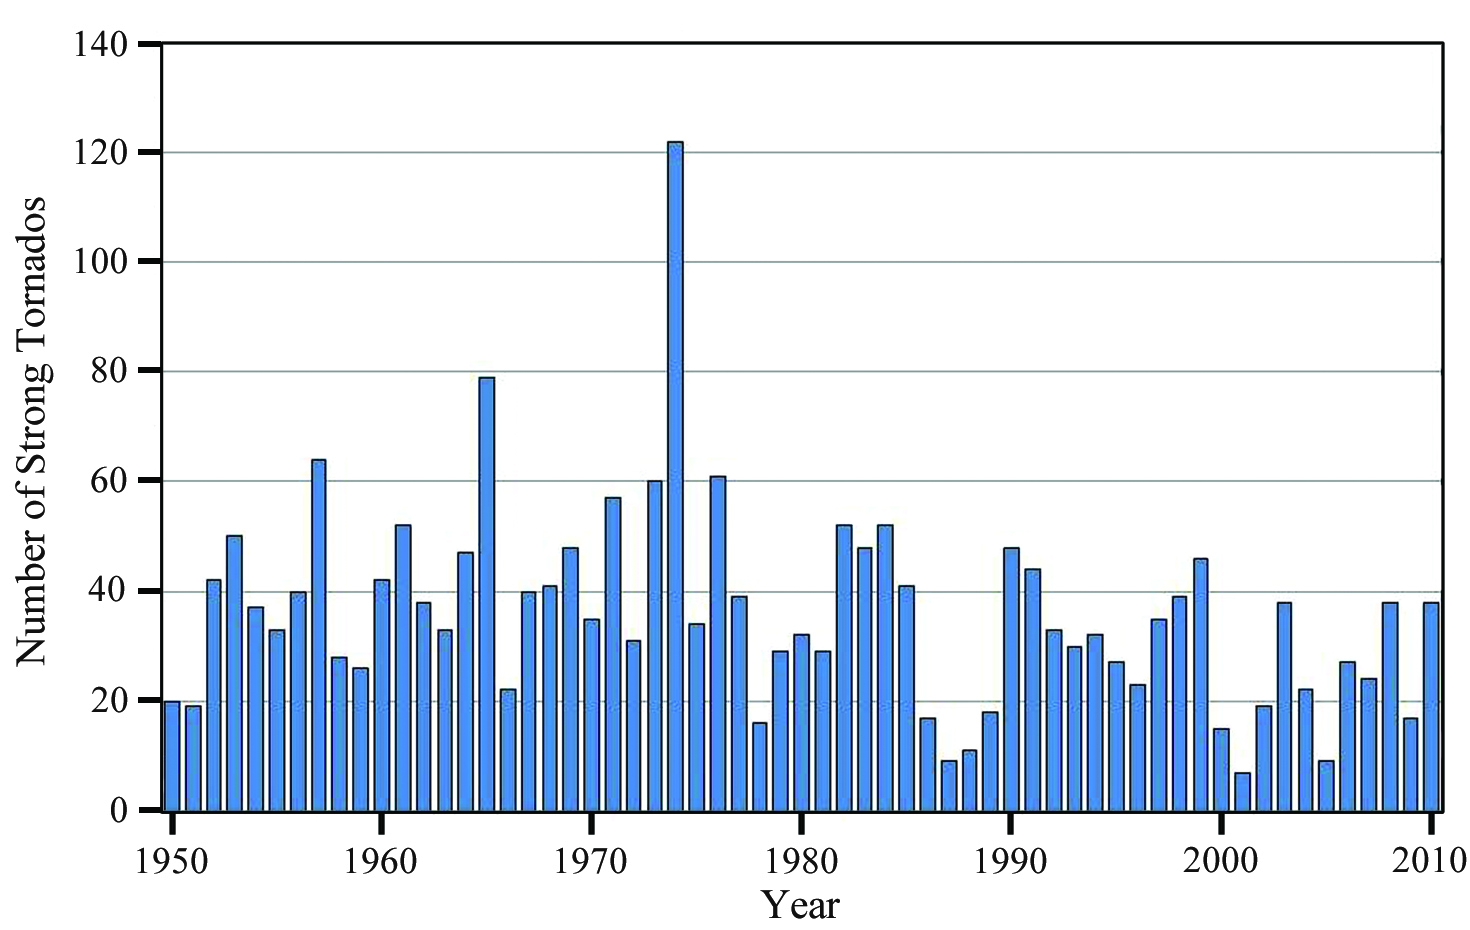
Tornados are a favorite of climate alarmists. In 2011, many claimed that violent tornados that hit the central and southern US were “influenced by, “affected by,” “fueled by,” or “contained fingerprints of” man-made global warming. But none of the alarmists commented on the almost complete lack of tornados in US weather of 2012. It’s true that the total number of tornados recorded has been increasing. But this is due to better radar detection techniques and many of these funnel clouds never touch the ground. A graph of data from the US National Climatic Data Center (NCDC) shows that the number of strong tornados peaked in the 1970s and has been declining for the last 30 years. There is no trend evidence to show that storms are getting stronger or more frequent due to human-caused greenhouse gas emissions.
Droughts and Floods?
The summer of 2012 brought hot weather and drought conditions to many areas of the central United States. Climate alarmists blamed the drought on man-made climate change. In 2010, the World Meteorological Organization blamed the massive floods in Pakistan that left millions homeless on man-made climate change. Either wetter or dryer, that one molecule of CO2 in 10,000 air molecules must be the cause.
This is an amazing planet with live on, with highly variable local weather conditions. For almost every week of the year, a flood, drought, storm, wildfire, heat wave, or cold snap occurs somewhere on Earth that appears to be a once in 500-year event. Each occurrence is now followed by a train of Climatists, proclaiming that man-made emissions “contributed to” the event.
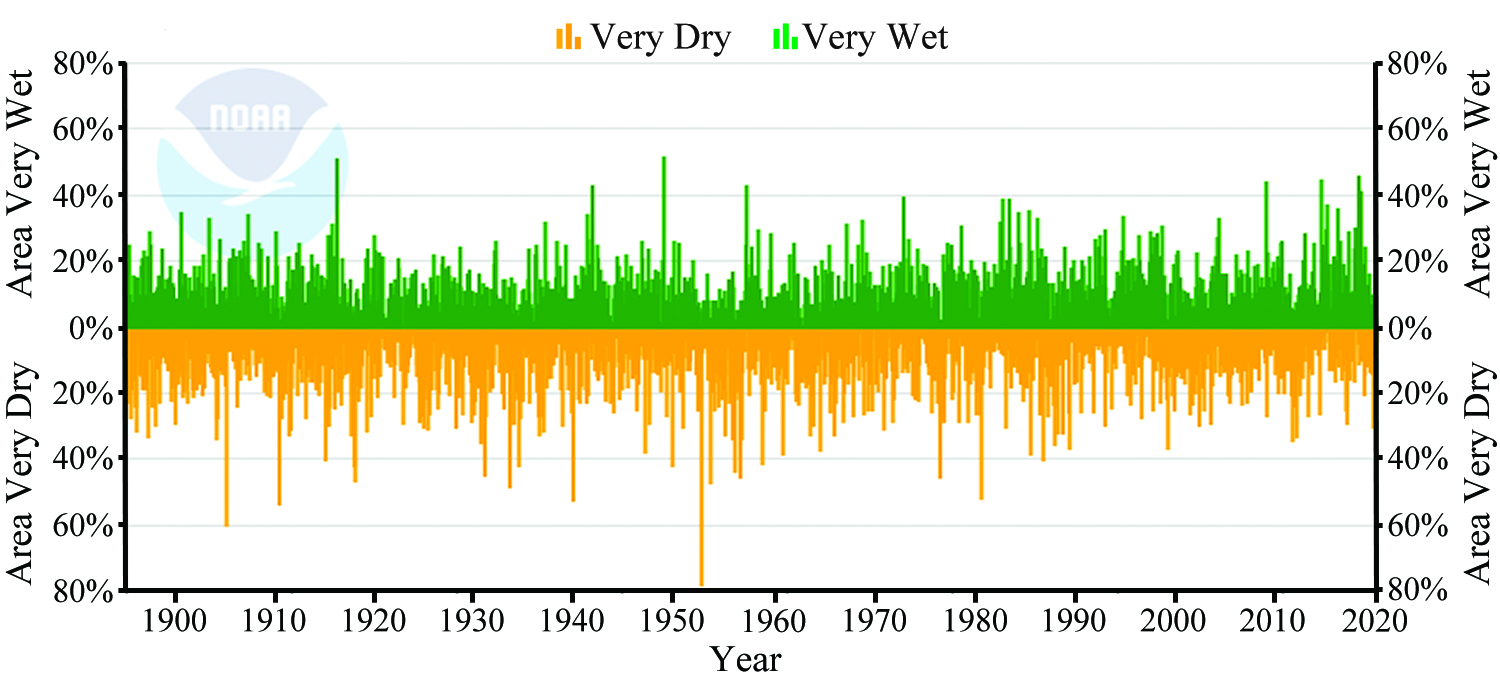
But a look at historical data shows that today’s droughts and floods are not abnormal in history. Data from the NCDC shows that the most severe periods of US drought were the 1930s and 1950s. Wet periods occur several times during the century, centered at about 1907, 1915, 1942, 1974, 1984, and 1996. No trend toward more extreme droughts or floods is apparent.
Study of past climatic periods in Africa show droughts that lasted centuries, much longer than droughts of the recent century. Other studies of Southeast Asia show periods of drought and flood that exceeded those experienced in modern times. Peer reviewed studies from around the world show that today’s drought and flood events are within the range of natural variability over the last 500 to 1,000 years.
Polar Bear Extinction?
One of the biggest whoppers of Climatism is that polar bears are endangered due to man-made global warming. The World Wildlife Fund raises millions every year to try to save the bear. Coca-Cola launches promotional campaigns every winter along with cute commercials in the Super Bowl. But most evidence indicates that polar bear populations are thriving.
According to several sources, global polar bear populations have increased from 8,000–10,000 in 1960 to over 25,000 today. The main reason for the population growth is hunting restrictions adopted by the governments of northern nations during the 1970s. Nevertheless, climate alarmists warn that shrinking arctic ice with destroy the habitat of the bear and endanger its existence.
But detailed scientific studies do not support such alarm. A study of polar bears in the Northern Beaufort Sea, along the north coast of Alaska, was published by the US Geological Survey in 2007. The study was rigorous and extensive, using bear capture, tagging, and electronic collaring to analyze bear habits and estimate populations. Despite the fact that late summer ice declined about 10 percent per decade over the study period, researchers found that the population of bears in the area increased from about 745 in the mid-1970s to 980 in the mid-2000s, an increase of about 30 percent. Since polar bears have existed for tens of thousands of years and have survived past warmer ages, it’s reasonable to conclude that they can adapt to conditions of reduced Arctic ice.
Comments by the Inuit people that live near the bear also differ from claims by alarmists. There are now so many bears that they have become pests, breaking into property and creating havoc for local residents. There is no solid evidence that polar bears are endangered, only alarming computer model projections.
Heat Waves?

Another whopper from Climatism is that, as the planet warms, heat waves will become more frequent and severe, endangering the health of populations even in developed nations. Climate alarmists discount the benefit of warmer winters on human populations. This is an example of “if man-made global warming causes it, it must be bad for people.”
People tend to get sick in the colder months, rather than the warmer months of the year. The influenza (flu) season is from November to April in the Northern Hemisphere and from May to October in the Southern Hemisphere, the winter months for the south. The number of COVID-19 cases were higher in the winter months than in the summer months for almost all nations. Multiple peer-reviewed studies show that many more people become ill during colder weather than warmer weather, and many more die as a result.
To mention just one of these studies, Dr. Matthew Falagas analyzed seasonal mortality for 11 nations. The average number of deaths per month was lower in summer and fall months and peaked in the coldest months of the year for all nations.
The next time one of your friends wants to retire to Florida or Arizona, inform him that the US government and the IPCC warn about premature death in warm climates. Maybe they should be retiring to Alaska or Greenland instead?